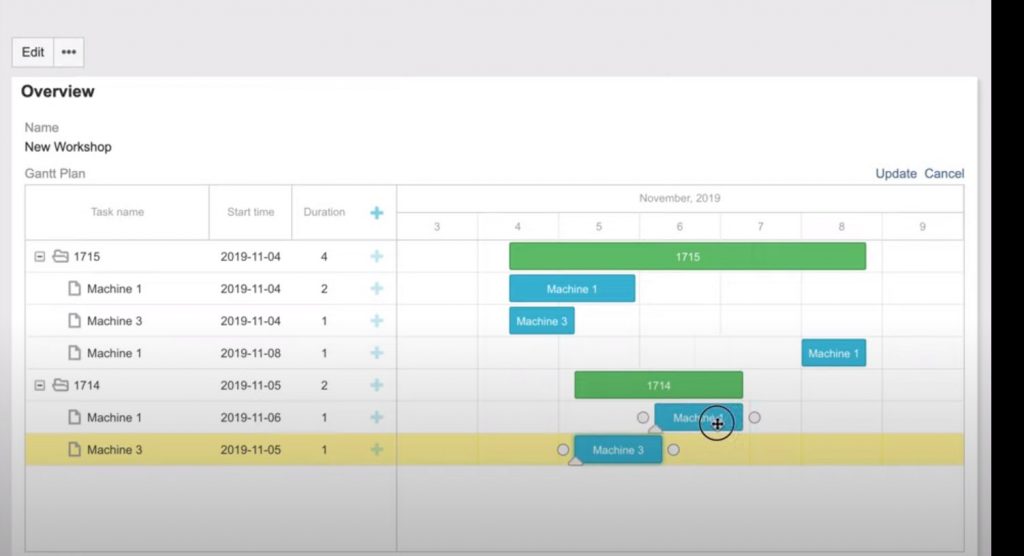
You will also find a Gantt chart in the CRM system. A Gantt chart is used in project management to graphically represent the scheduling of a sequence of activities over time.
Where you can e.g. Gantt chart to use:
- The Building Industry – you need to have precisely planned activities and deliveries
- Software development – it is a good idea to use a Gantt chart in any software development.
- and wherever you really need to manage projects.
We can also call it the so-called. timelines. Everyone who has been involved in project management knows the Gantt chart.
With this tool you can plan new projects and have a very good overview of them. And that’s why the Gantt chart is also very popular with all projectionists.
What is it? The horizontal axis in the chart shows illustrations of the temporal development of your project, program, or perhaps distributed work. It is ideal for tracking timelines or important milestones, where the length of the bar shows the time it will take to complete each task.
And of course you can also see who is working on the task and how much time they have spent on it.
Personalisation, placement and timing? With a Gantt chart you know what is being done when, where and by whom.
On one side you have the tasks they have to do and on the other side everything else that is related to the tasks. Employees or time data.
Thanks to the visual display, project managers have a better view of each individual task and activity through different projects. Thanks to the timeline, everyone knows what they have to do, how much time they have to do it, and can even say that they need more time for a given task.
It is good for managers to see a better distribution of people in the project. You can see exactly who’s working on what.
You can plan in details
It is very important to allocate time when creating project plans. If time cannot be kept, then managers lose money. At the same time, it’s good that you can keep track of every single detail of the project thanks to the chart, the tasks, their names, the staff working on the tasks and the project, the length of the project, etc.
Managers can see exactly how the project is progressing and it is then a complete overview for project managers. Clients will see the timeline of the entire project and also see when and who is responsible for what. They can then contact the employees in question.
And every plan must be followed.
Transparency
The details of the project are very important and the timeline also shows the individual relationships between tasks.
As a project manager, you have a very clear idea of which tasks are dependent on others and how other resources should be allocated between them.
Real time is important and progress is also important
Every project manager needs to see how much the project is progressing and what is done and what is not. If all collaborators are entered into the diagram, the current progress can be monitored.


